

We've compared the total deaths in a particular area with how many of them were caused by Covid 19.
Workingout the percentages, we can see what havoc this awful disease has wreaked on our communities over the last year.

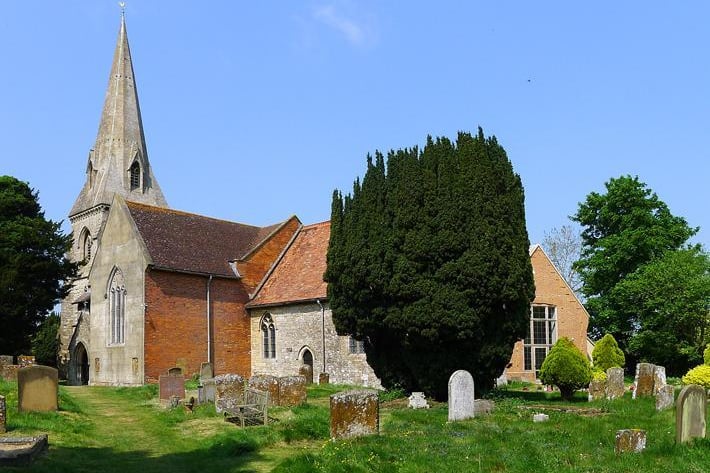
5. Number Twenty
Waddesdon & Whitchurch Deaths from all causes 12 month total (March 2020 to February 2021): 77 Deaths from Covid-19 12 month total (March 2020 to February 2021): 7 % of deaths related to Covid: 9% Photo: JPI
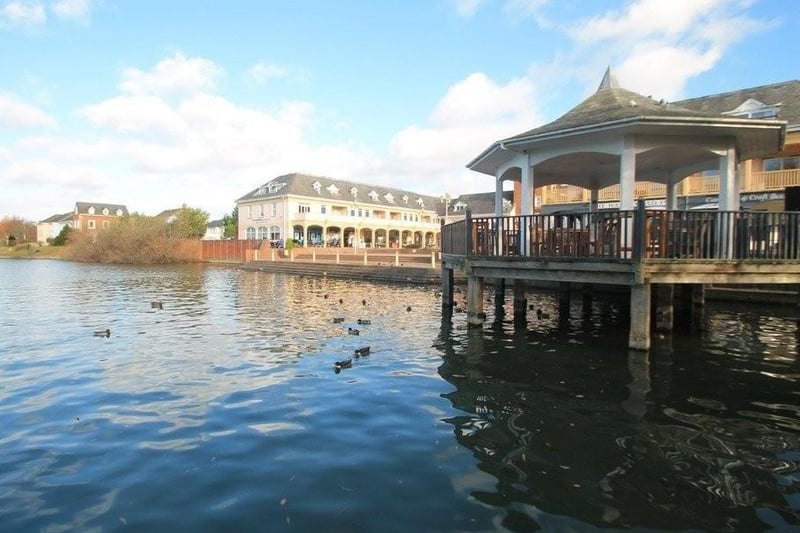
6. Number Nineteen
Watermead Deaths from all causes 12 month total (March 2020 to February 2021): 32 Deaths from Covid-19 12 month total (March 2020 to February 2021): 3 % of deaths related to Covid: 9% Photo: JPI
7. Number Eighteen
Marsh Gibbon, Steeple Claydon and Tingewick Deaths from all causes 12 month total (March 2020 to February 2021): 71 Deaths from Covid-19 12 month total (March 2020 to February 2021): 9 % of deaths related to Covid: 13% Photo: JPI

8. Number Seventeen
Winslow and Padbury Deaths from all causes 12 month total (March 2020 to February 2021): 79 Deaths from Covid-19 12 month total (March 2020 to February 2021): 12 % of deaths related to Covid: 15% Photo: JPI