

The current U.K average cases rate per 100,000 is 27.9.
We've got the recorded infection rates from 1 of April to the 8th of April - so you can see how infection rates are changing in your area.
Some areas have shown a dramatic reduction in cases, while in some the case numbers seem to be proliferating.
The latest Government figures show 4,651 neighbourhoods in England were almost Covid-free in the first week of April, with fewer than three cases in the latest seven-day period.
Now with gyms, bars and restaurants opening up to customers again, we reveal which neighbourhoods saw the fewest number of cases between 1 and 8 April.
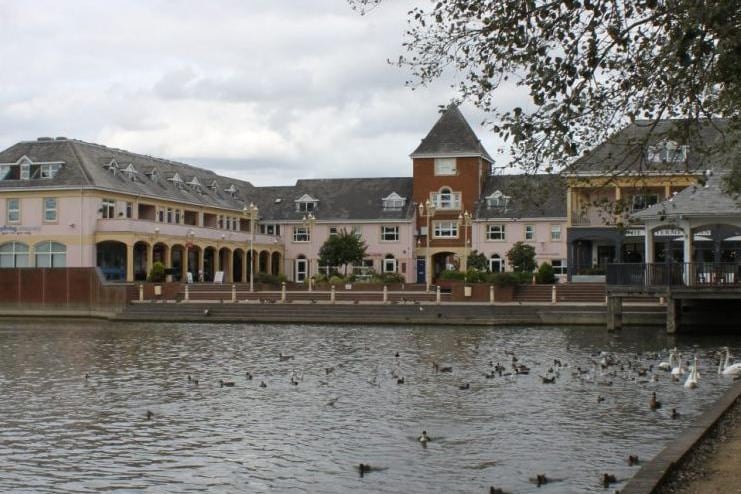
1. Watermead
Case rate per 100,000 on April 1: 0 Case rate per 100,000 on April 8: 44.7 Increase of 44.7 cases per 100,000 Photo: JPI
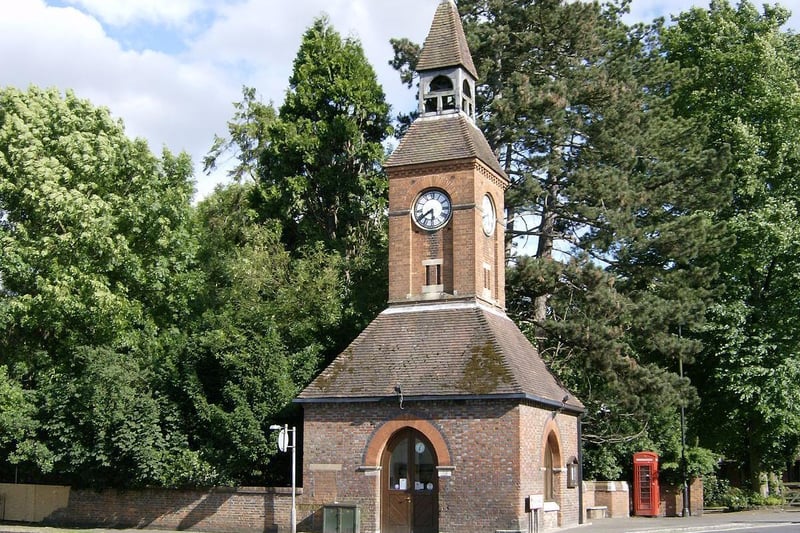
2. Wendover
Case rate per 100,000 on April 1: 0 Case rate per 100,000 on April 8: 62.6 An increase of 62.6 cases per 100,000. Photo: JPI
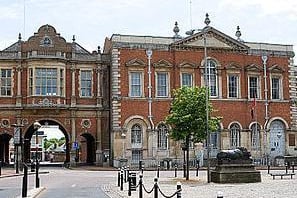
3. Aylesbury Town Centre
Case rate per 100,000 on April 1: 0 Case rate per 100,000 on April 8: 47.7 Increase of 47.7 cases per 100,000 Photo: JPI

4. Wing, Wingrave & Bierton
Case rate per 100,000 on April 1: 0 Case rate per 100,000 on April 8: 67.3 An increase of 67.3 cases per 100,000 Photo: JPI